
A $2.45M Transit Investment Deserves Better Than "Miles Driven": Measuring Access, Not Distance

In today’s competitive funding market, a major transportation investment must show more than activity; it must show meaningful access and community value. You often have plenty of operational data (miles driven, rides provided, vehicles deployed) but not enough evidence to explain whether people reached work, health care, training, or other essential destinations. This is where an access-focused reporting framework becomes invaluable. For the Southern Indiana Transit System expansion, the right measurement system can help you show what a two-year pilot made possible and what it should sustain.
1. The Investment Creates a Clear Reporting Opportunity
The Community Foundation of Southern Indiana is investing $2.45 million in a two-year initiative to expand the Southern Indiana Transit System across Clark and Floyd counties. Blue River Services, Inc. operates the system, with expanded service scheduled to begin on October 14, 2026.
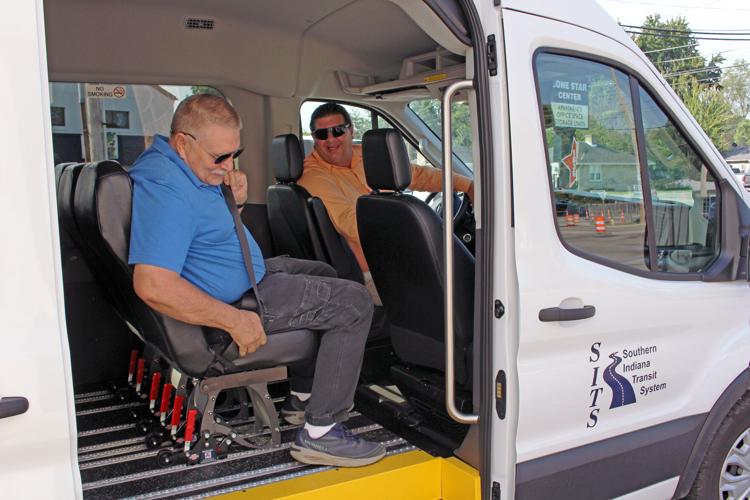
The expansion will combine on-demand transportation with deviated routes. The service will be open to the general public without Medicare, Medicaid, income, age, or other eligibility requirements. Fares within the service area will range from $2 to $4 each way based on distance, and the expanded fleet will include ADA-accessible minibuses.
The stated goal reaches beyond launching vehicles. CFSI and Blue River Services intend to collect data that demonstrates long-term demand and value for sustainable public transportation. That purpose creates an important reporting responsibility: you need to measure not only what the service does, but also whether it improves access to employment, health care, training, and everyday destinations.
2. Miles Measure Effort, Not Effect
Miles driven can confirm that vehicles operated. They cannot confirm that the right riders reached the right destinations at the right time. A vehicle may cover substantial distance while riders still experience long waits, denied trips, missed appointments, or limited connections to employment.
The Federal Transit Administration’s mobility performance metrics framework identifies measures such as service denials, canceled trips, wait time, and reliability as useful indicators of mobility performance. Those measures help you move from reporting effort to examining access.
For example, “rides provided” may tell you that a rider entered a vehicle. It does not tell you whether the rider arrived before a medical appointment, reached a work shift, or received a requested wheelchair-accessible vehicle. A stronger report connects each completed trip to its purpose, destination type, service quality, and outcome.
3. Measure Demand Before You Measure Success
Ridership is important, but ridership alone can hide unmet demand. Your first KPI should distinguish between trips requested, trips scheduled, trips completed, trips canceled, and trips denied.
A practical dashboard can include:
Total trip requests
Completed trips
Requests fulfilled
Requests denied
Denials by reason
Rider cancellations
Provider cancellations
Unmet demand rate: denied requests divided by total requests
The unmet-demand number may be the most important measure in the system. If you report only completed rides, you may unintentionally present limited capacity as limited demand. By tracking every request, you can show where the service is meeting need and where scheduling, staffing, vehicle availability, geography, or timing still creates barriers.
For example, a request for transportation to a job should not disappear from the report simply because no vehicle was available. You should preserve the request, the requested time, the destination purpose, the denial reason, and whether an alternate time was offered. That record gives CFSI and community partners a clearer view of the service gap.
4. Track Access to Essential Destinations
The central question is not how far vehicles travel. The central question is what riders can reach because the service exists.
Your KPI library should classify trips by purpose, including:
Employment
Medical appointments
Health care services
Workforce training
Education
Grocery and essential shopping
Government or social services
Other community destinations
You should also distinguish unique riders from repeat riders. Unique-rider counts help you understand reach. Repeat-rider patterns help you understand whether the service supports ongoing access, such as a recurring work schedule or regular medical care.
The CFSI announcement identifies employment, health care, training, and everyday needs as central reasons for the investment. Your reporting should therefore connect trips to those purposes rather than placing every ride into one undifferentiated total.
For example, a monthly report could show the number of completed employment trips, the number of medical trips, and the number of unique riders who used the service for each purpose. You can then add a short narrative explaining where riders traveled and which access barriers the service helped address.
5. Make Accessibility Visible in the Data
An accessible-transit program needs accessibility KPIs. You should not assume that a vehicle’s availability proves that an accessible trip occurred.
Your reporting system should capture:
Whether a rider used a wheelchair or other mobility device
Whether an ADA-accessible vehicle was requested
Whether an accessible vehicle was available
Door-to-door or curb-to-curb service
Pickup and drop-off times
Wait time
Trip denials by reason
Alternate times offered
Accessibility-related complaints or service issues
Blue River Services describes SITS as a door-to-door service and identifies wheelchair-accessible vehicles among its transportation resources. You can use those service characteristics as the foundation for precise definitions in your dashboard. For instance, “accessible trip completed” should have a consistent meaning across dispatch records, monthly reports, and funder updates.
Reliability also belongs in this section. You should track on-time pickup performance, average wait time, cancellation rate, and arrival timing for appointments when the data is available. A completed ride that arrives too late for a scheduled appointment does not demonstrate the same level of access as a completed ride that supports the appointment.
6. Report Cost per Outcome, Not Only Cost per Ride
Cost per ride is a useful operational measure. It can help you understand the resources required to operate the service and compare performance across months. However, cost per ride does not explain whether the investment improved access.
You should pair cost per ride with outcome-oriented measures such as:
Cost per unique rider served
Cost per completed employment trip
Cost per completed medical trip
Cost per rider who used transportation repeatedly for work
Cost per scheduled appointment trip completed
Cost per fulfilled request
These measures require careful definitions. You should not claim that transportation alone caused someone to maintain employment or attend an appointment. Instead, you can report transportation-related contribution using clearly documented indicators.
For example, you might report the cost associated with completed employment trips and separately track whether riders reported that transportation supported continued access to work. That distinction protects the credibility of your report while still showing how the program contributes to broader community goals.

7. Establish the Baseline Before October 14
The most important measurement window may occur before the service begins. If the October 14 launch happens without a baseline, you can report what the expanded system did, but you may not be able to demonstrate what demand existed before the expansion.
Before launch, you should capture:
Existing trip requests
Trip denials
Unmet transportation needs
Waitlists
Requests for employment transportation
Requests for medical transportation
Referral sources
Common origins and destinations
Preferred travel times
Accessibility requirements
Transportation barriers identified by residents and partners
You should gather this information from employers, health systems, workforce programs, disability-service organizations, local governments, and other referral partners. You can also preserve findings from community surveys and listening sessions as part of the baseline record.
For example, if a workforce organization reports that clients regularly decline jobs because transportation is unavailable, you should document the referral source, location, job-related need, and requested service timing. You can then compare that pre-launch demand with post-launch trip requests, fulfillment, and access patterns.
8. Build the First 30 Days Around Measurement
You do not need a complicated analytics platform to begin. You need consistent definitions, reliable dispatch fields, and a monthly reporting rhythm.
During the first 30 days, you should:
Freeze the KPI list and definitions.
Define the difference between a request, scheduled trip, completed trip, cancellation, and denial.
Add denial reasons to the dispatch workflow.
Capture requested and actual pickup times.
Record trip purpose and destination category.
Track accessibility requirements and vehicle availability.
Collect baseline information from referral partners.
Build a monthly dashboard for operations, leadership, and funders.
Set the first quarterly reporting date with CFSI.
Review data quality before publishing the first report.
A useful dashboard should show both volume and meaning. You can include total requests, completed trips, unmet demand, average wait, on-time performance, trips by purpose, unique riders, geographic coverage, and cost measures. You should also include a short narrative that explains what changed, where demand remains unmet, and what operational decision follows from the data.

Final Thoughts
The Southern Indiana Transit System expansion gives Clark and Floyd counties a meaningful opportunity to improve transportation access. The $2.45 million investment, two-year initiative, public availability, $2-to-$4 fares, on-demand service, deviated routes, and ADA-accessible vehicles create a strong foundation for learning what sustainable transit can accomplish.
Your reporting should make that value visible. By measuring unmet demand, access to employment and health care, accessibility, reliability, equity, and cost per outcome, you can show more than miles driven. You can show who gained access, which needs remain unmet, and what evidence supports continued investment.
If you are preparing to measure a transit, workforce, health-access, or disability-services program, the Genesis Reporting Diagnostic can help you build the KPI definitions, dashboard structure, data-quality checks, and reporting cadence before launch. With the right measurement framework in place, a two-year pilot can produce evidence strong enough to guide the next two years.
Comments